8 rigs in a scene, on their lowest LOD of ragdoll markers, maybe a dozen each takes 95 min to record.
We’ve got 5 of these setups, each with their own solver for each 8 rigs, so 5 solvers x 95min is how long it’ll take us to record this shot that’s 65 frames long.
- it seems like a long time to record the animation? What could we be doing wrong?
- we have to wait until one solver is done recording until beginning the next recording? Or is there another way to batch record multiple solvers in a scene? If we can’t get the times down we’ll have to record overnight, but if we have to wait and kick off each solvers recording we wouldn’t be able to do it overnight.
- is there anyway to offload this process outside of Maya to something stand alone to speed this up?
Thanks!
Step one is identifying where the bottleneck is.
Head over to the Profiler and see what this gets you.
- Windows → General Editors → Profiler
- Play Maya
- Click
Start Recording
- A few frames later,
Stop Recording
- Find “rSolverShape” in the window
In dense scenes, you can filter using the text-field on the left to find it amongst the chaos.
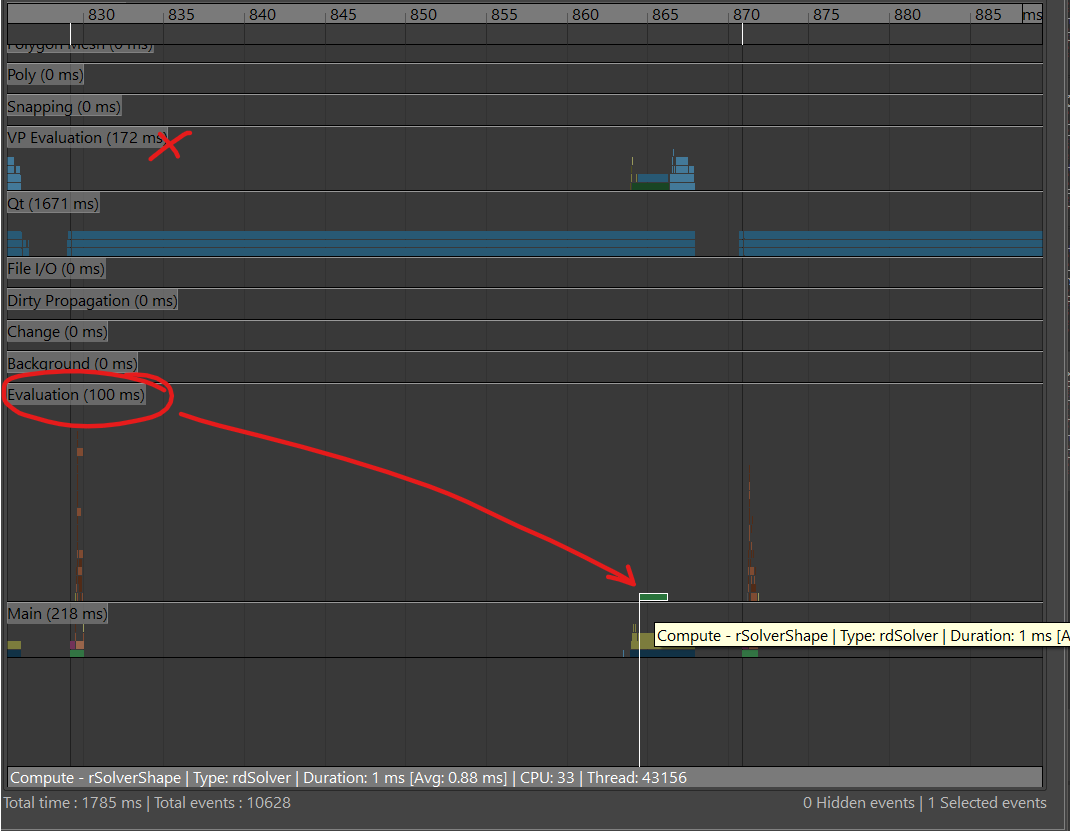
In this case, I get 0.88 ms spent solving physics. Then look for anything rMarker, these would be the ones that read from your rig, they wait for the rig to finish solving its current pose.
Recording would playback the scene twice, once to read the controls and a second to write to them. At 95 mins, 5,700 seconds over 65 frames, suggests 87/2 = 44 seconds per frame. Ragdoll generally takes 0.1-5.0 milliseconds per frame, especially if there are only 12 Markers involved.
Before we can answer that, we must determine the cause of the slowdown, so give the above a try first.
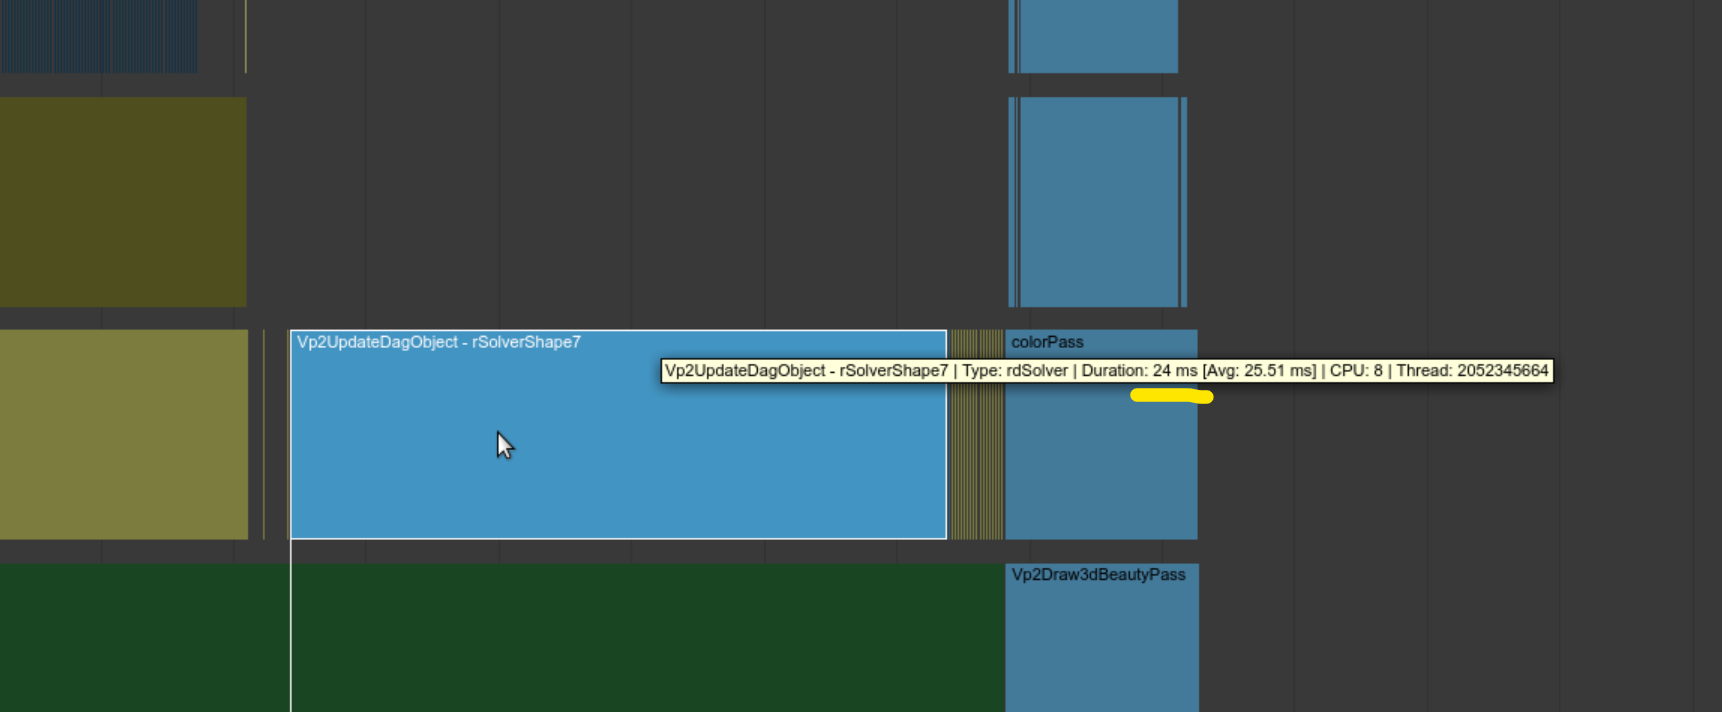
Thanks, we’re seeing 25.51 ms on the rSolver
Thanks for investigating. However that is the time spent rendering the solver in the viewport, what we’re looking for in the context of recording is evaluation.
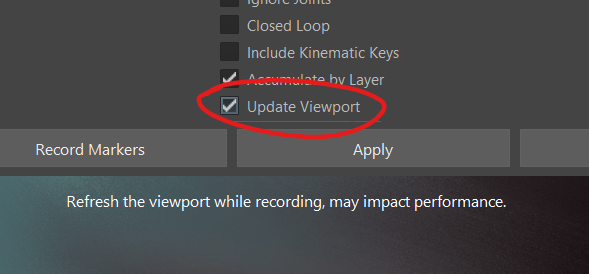
That said, 25 ms to render is still a very long time. It’s greater than real-time, 1000/25=40 fps, but it does seem suspicious. In this case, one optimisation you could do is to disable viewport rendering during recording.
In your profiler, you’ll also be able to spot time taken across an entire frame, for your entire rig. If you are not used to it, I would recommend taking some time to familiarise yourself with it; the biggest blocks in the Evaluation category are the biggest offenders and the ones you’ll want to pay special attention to.